03 / AI REPO RADAR
Graphify-Labs/graphify
129,243 starsLicense: Apache-2.0Last push: On the radar:
A skill for AI coding assistants that turns a codebase plus docs, PDFs and configs into a local knowledge graph the agent can query instead of grepping file by file.
What Graphify is and the problem it targets
Graphify is an open-source project from the Graphify-Labs group, described as a tool that turns any codebase, together with its docs, SQL schemas, configs and PDFs, into a queryable knowledge graph. According to the README it ships as a skill named graphify for Claude Code, Cursor, Codex and Gemini CLI. At collection time the repository had 129,243 stars on GitHub and used the Apache-2.0 license.
The problem it targets will be familiar to anyone using an AI coding assistant. When you ask about a large codebase, the agent usually has to grep and open one file after another to rebuild the overall picture, and that picture disappears after each session. Graphify proposes doing that work once: type the graphify command in your AI assistant, and the tool scans the whole project, including code, docs, PDFs, images and video, then stores the result as a graph the agent can ask again at any time.
The README stresses three ideas. First, code is mapped for free and entirely locally, because it is parsed with tree-sitter syntax trees in a deterministic way, with no language model involved and nothing leaving the machine. Second, every edge in the graph is explained. Third, this is not a vector index: there are no embeddings and no vector store, only a real graph you traverse.
How it works: a graph instead of a vector index
According to the README, each connection in the graph carries one of two tags. EXTRACTED means the relationship is explicit in the source, while INFERRED means Graphify resolved it itself. That lets a reader, and the agent too, tell what was read directly from the code apart from what is only inferred, which is a notable difference from retrieval systems that simply return similar chunks of text.
Cross-file links such as calls, imports, inherits and mixes_in are resolved across roughly 40 programming languages through tree-sitter parsing. Code comments in the NOTE or WHY style, along with ADR and RFC citations, become first-class nodes linked to the relevant code, so the design rationale lives in the same map as the code itself.
The graph is split into communities, meaning subsystems, using the Leiden algorithm, and their labels are produced without a language model. The README also mentions god nodes, the most-connected concepts, which show what everything flows through. The output is written as three files, including graph.json as the persisted graph, a GRAPH_REPORT.md report for broad architecture review, and a clickable graph.html page for exploration.
The persisted graph also carries a schema_version field so outside integrations can detect incompatible format changes, plus a graphify_version field identifying the Graphify release that produced it. The README does not describe the internal structure of this file any further in its introduction and points readers to the How graphify works documentation.
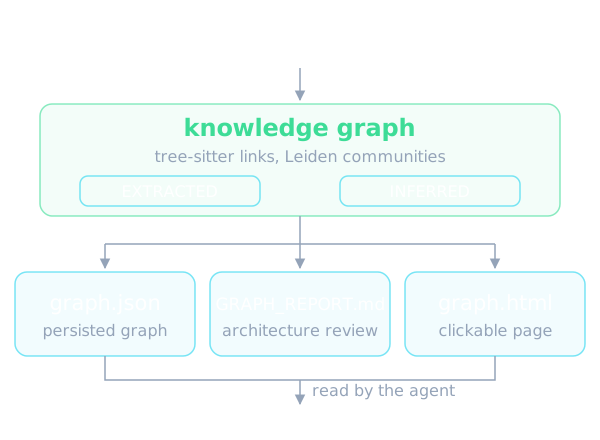
Main features
The query, path and explain commands are the main way to use it. The graphify query command takes a plain-language question and returns a scoped subgraph, graphify path traces how any two things connect, and graphify explain describes a single concept. All of them run against graph.json. The README says that if a name matches several nodes, the command refuses and lists the candidates instead of guessing, and scripts can read the outcome from the exit code: 0 for an answer, 3 for an ambiguous name and 4 for no matching node.
Beyond source code, Graphify handles docs, PDFs, images and video or audio, all mapped into the same graph. The README is explicit about the privacy boundary here: video and audio are transcribed locally with faster-whisper, while docs, PDFs and images are sent to the assistant's model for semantic extraction. For headless runs you need to configure a provider API key, or a local Ollama instance, or AWS credentials for Bedrock, or the claude binary itself.
There are many optional extras installed separately. The README lists extras such as pdf, office for docx and xlsx, video, mcp for an MCP stdio server, neo4j, falkordb, svg, leiden, backends such as ollama, openai, gemini, anthropic, bedrock and azure, plus many specialized language extractors such as sql, terraform, pascal, ocaml, commonlisp and robot. An extra named all installs everything.
The project also supports shared team setups. You can commit or share the graph so the whole team queries the same context, and use the graph when reviewing pull requests. A .graphifyrc file placed in the scan root lets you declare project-level settings, for example what ambiguous extensions such as .h, .inc or .m mean, because the README warns that guessing the wrong language leaves a graph that looks populated while the real symbols are missing.
Installation and trying it out
The README describes getting started as taking about 30 seconds and needing Python 3.10 or newer plus uv, with pipx as the alternative. There is an important note about the package name: the official PyPI package is graphifyy with a double y, and other graphify packages on PyPI are not affiliated. The command you run is still graphify. The README also states that the official source repository is Graphify-Labs/graphify, worth remembering to avoid installing an imposter package.
After installing, you run graphify install once. It detects which assistant you use and registers the skill, so there is no per-assistant setup. Then you open your AI assistant and type the graphify command with the project path. Codex alone uses a dollar sign in place of the slash. If you want to install the skill into the repository itself instead of your user profile, you can add the project flag, in which case files are written under the current directory, for example in the Claude or agents skill folder, and can be committed.
The list of supported platforms is long, more than 20 assistants across macOS, Linux and Windows: Claude Code, Cursor, Codex, Gemini CLI, GitHub Copilot, OpenCode, Kilo Code, Aider, OpenClaw, Factory Droid, Trae, Kiro, Amp, Devin CLI, Google Antigravity and others. Each platform has its own install command. The README notes that Codex needs multi_agent enabled in its configuration for parallel extraction, while OpenClaw and Aider use sequential extraction because parallel agent support there is still early.
To remove it, the graphify uninstall command covers all platforms at once, and you add the purge flag if you also want to delete the graphify-out folder. Troubleshooting and detailed guides are delegated by the README to separate documentation. The README copy we collected ends with a Troubleshooting section that only mentions common install and extraction issues, so there is nothing more to summarize there.
Using it in an AI agent workflow
The most practical value is in making the assistant always consult the graph. After building a graph, running graphify install in the project, for example graphify claude install or graphify codex install, writes a small config file telling the assistant to ask the graph for codebase questions, preferring scoped graphify query calls over reading the full report or grepping raw files.
How this is enforced differs by platform. For Claude Code and Gemini CLI, the README says a hook fires automatically before search-style tool calls, and on Claude Code also before reading source files one by one through the Read or Glob tools, to nudge the assistant down the graph path. For Codex, OpenCode, Cursor and other platforms, persistent instruction files such as AGENTS.md or Cursor rules provide the same query-first guidance. The GRAPH_REPORT.md report is still available when you need a broad architecture review.
The README also distinguishes two integration styles: a local CLI with an installed skill, or a connected MCP server. With the first, the instructions come from graphify install and the agent runs graphify query, path and explain against the local graph. With the second, the instructions and tools come from the MCP connection itself. The graphify install command only installs the local assistant integration and does not create an MCP connection. If you use both, the README advises picking one primary query path and identifying which graph each side queries, rather than pasting both instruction blocks unconditionally into AGENTS.md.
For people building agents, this suggests a design pattern: put project structure into a queryable knowledge layer, separate from the context window. The README claims this approach lets agents ask instead of read, but we rely only on the README's description and have not verified the savings in practice.
Benchmark figures published by the author
The README contains a benchmark table published by the author, headlined as 0.497 recall@10 with 0 LLM credits. On LOCOMO with 300 samples, Graphify's recall@10 is 0.497, against 0.048 for mem0 and 0.149 for supermemory. Also on LOCOMO, QA accuracy is 45.3%, while supermemory reaches 49.7% and mem0 reaches 27.3%. In other words, on that metric Graphify does not lead, and the README says so plainly.
On LongMemEval-S with 50 samples, QA accuracy is 76%, tied with dense RAG. On the ERPNext cross-tool test with 6 samples, key-fact coverage is 82.0%, against a grep and read baseline of 70.8%. For building the graph, LLM credits come to 0, while the author says most other systems charge per token.
The author states that every system ran on the same harness with the same model and budgets, and that scores come from a judge that was blind-validated against a second judge, reaching 90.6% agreement and a Cohen's kappa of 0.81. The full tables, the code-intelligence result and the reproduction commands are in BENCHMARKS.md.
These numbers need to be read in context. They are self-published figures, the sample sizes of some tests are quite small, and we did not rerun them. A serious evaluator should reproduce them with the commands in the author's documentation, on data close to their own project, before relying on them.
Privacy and things to watch
On privacy, the README lists each data type explicitly. Code is processed locally with tree-sitter and does not leave the machine; a code-only corpus needs no API key and graphify extract runs fully offline. On a mixed repository you can add the code-only flag to index just the code. Docs, PDFs and images are sent to the assistant's model or to the configured backend. The README states there is no telemetry, no usage tracking and no analytics.
For data with residency requirements, the README advises setting the backend to ollama to run fully locally, or setting GRAPHIFY_BACKEND to none to disable all LLM backends and keep a code-only graph. It also warns that the Kimi key routes to Moonshot AI servers in China. When the provider is auto-detected, the tool prints the environment variable that made the choice, so the user is never surprised.
One easily missed detail is query logging. Every query, path and explain command and every MCP query_graph call is written to a JSON Lines log file in the user's cache folder, including timestamp, question, corpus, number of nodes returned and duration. Full subgraph responses are not stored by default. You can opt out by setting GRAPHIFY_QUERY_LOG_DISABLE to 1.
Also note that the README opens with several promotions for Graphify Cloud, a paid service with a free 14-day trial and claims such as cutting agent token spend by 80%. That is the commercial side of the authors and a claim they make themselves; the open-source part described in this article is the local one. The README does not detail how Graphify Cloud reaches that figure, so we do not assess it.
When to use it and when not to
Graphify suits projects with many files, many languages or lots of accompanying documents that an agent keeps having to rediscover from scratch: monorepos, legacy systems you need to get familiar with, or codebases that carry ADRs and RFCs. If you want an explainable query layer where each edge says whether it was read directly or inferred, and you want code to stay on your machine, its design fits well.
It also fits when a team uses several different assistants. The README says one install works for more than 20 assistants, so the graph and the query instructions can stay consistent across tools, and sharing the graph within the team lets everyone ask the same context.
Conversely, for a small project of a few files, the setup cost and an extra configuration layer for the assistant may not be worth it. If most of your value lives in docs, PDFs and images rather than code, remember that this part needs a semantic extraction pass through a model, which means cost and data leaving the machine unless you use a local backend. Take care to choose the right graphifyy package name when installing.
Finally, the README introduction does not fully describe the limits of resolving inferred relationships, accuracy per language, or how the graph is updated as code changes, and instead points to separate documentation. So before adopting it in an official workflow, try it on a real project, read the Supported inputs and How it works documents, and compare the INFERRED labels against the actual code.
Written automatically by AI from the repo's README and GitHub API data, with automated checks but no human review of every sentence. Report mistakes by email.